Data Management
In my Data Management and Analytics course at Cal Poly I learned to use Excel and Tableau to explore and visualize data.
-
My Excel skills enable me to efficiently organize and manipulate data, ensure accurate inputs, perform complex calculations, and create user-friendly spreadsheets for tasks such as estimating, data cleaning and financial tracking.
Data validation
Name ranges
Error handling
Data cleaning techniques such as text to columns and concatenation
Vlookups with table arrays and lookup arrays
Nested MATCH statements
Contextual menus
Conditional formatting with INDEX function
-
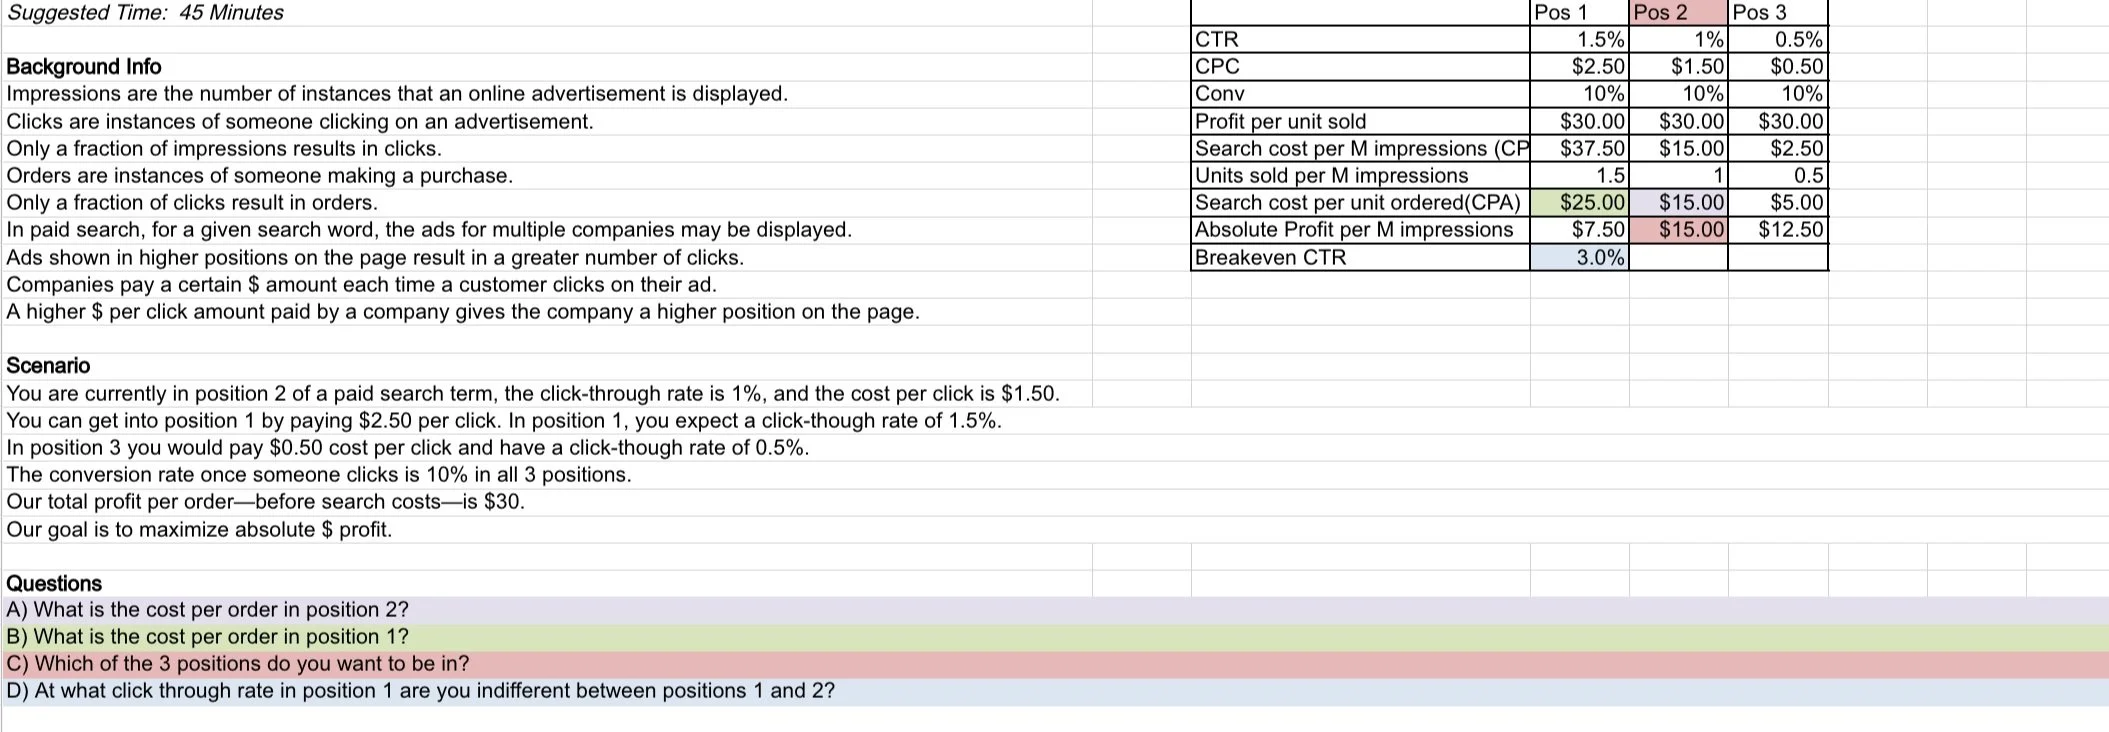
I am able to use formulas in Excel to calculate essential metrics like cost per click (CPC), click-through rate (CTR), cost per sale (CPA), cost per thousand impressions (CPM), and profit per sale. These data points hold significance in determining the most efficient and cost-effective advertising strategies.
-
My Tableau skills include using Tableau Prep Builder to clean and organize data, performing tasks such as field deletion, value grouping, data splitting, and applying filters. I have experience creating joins between datasets and exporting refined .csv files. Additionally, I have utilized Tableau Desktop to analyze survey data on student demographics, creating visualizations like maps, scatterplots, and bar charts. In another project, I conducted an AirBnb analysis, employing visualizations such as treemaps, heatmaps, line charts, and stacked bars to compare prices based on various factors. I also created interactive dashboards using filters and parameters.
Download Market Analysis Sample here.
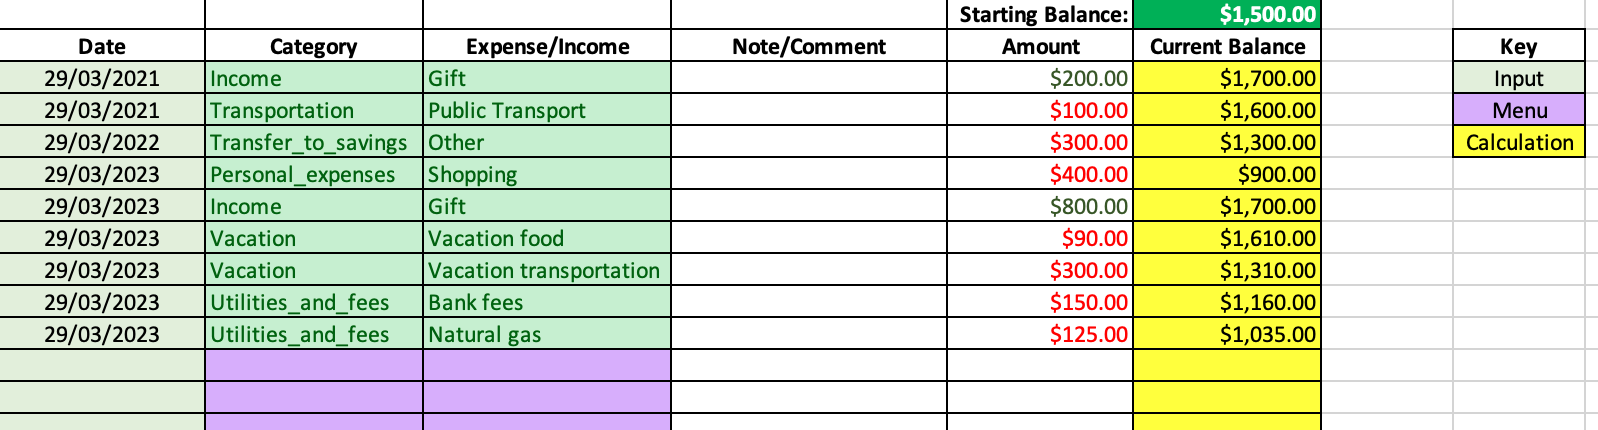
Download Financial Tracking Sample here.
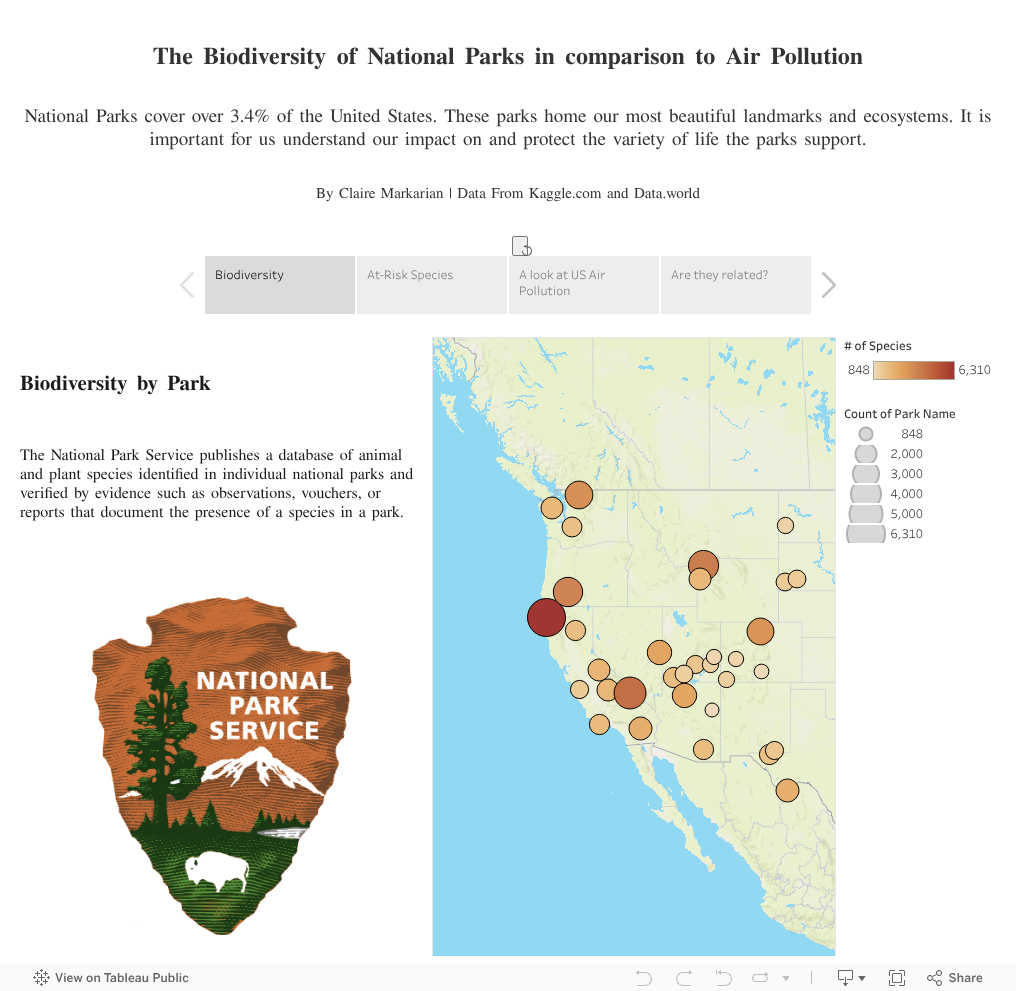
Final Project
In my final project, I conducted a comprehensive analysis comparing the biodiversity of national parks with the levels of air pollution in their respective areas. Using Tableau, I created a captivating story that unfolds across multiple pages of dynamic graphs.